Step 4. Selection of the FOD amplitude cutoff
The fibre orientation distribution (FOD) amplitude cutoff determines the minimum FOD amplitude at which tracking continues. A high cutoff terminates streamlines before they reach the target; a low cutoff, in unconstrained tracking, produces spurious streamlines. The corridor alters this trade-off. With tracking confined to the corridor, a permissive cutoff produces well-formed bundles while consuming far fewer seeds than a conservative cutoff. This behaviour should be verified for each dataset and tract family by a pilot sweep on a small number of participants, followed by tabulation and side-by-side inspection of the reconstructions.
Cutoff in routine use
The value in routine use with the corridor mask is 0.01, and it is the default in 00_config.sh. It is the recommended starting value for any tract reconstructed with this workflow; the pilot sweep described below confirms it for a new dataset or tract family and takes under an hour. Table 1 lists the cutoffs that have been used with the atlas.
Table 1
FOD Amplitude Cutoffs in Use
| Setting | Cutoff | Outcome |
|---|---|---|
| Corridor workflow, 3 T multi-shell data (example dataset): posterior and anterior ventral tegmental area (VTA) → hippocampus | 0.01 | Value used for the example dataset |
| Corridor workflow, VTA → accumbens (other users of the atlas) | 0.01 | Reported to reconstruct the tract |
| Atlas construction, 7 T: VTA → hippocampus (both pathways) | 0.06 | Value used to build the atlas |
| Atlas construction, 7 T: VTA → amygdala | 0.08 | Value used to build the atlas |
| Atlas construction, 7 T: hippocampus → accumbens → ventral pallidum | 0.04 | Value used to build the atlas |
| Atlas construction, 7 T: VTA → accumbens (both divisions) and ventral pallidum → VTA | 0.03 | Value used to build the atlas |
| Corridor workflow, atlas authors' worked example (inferior VTA → accumbens, 2 mm-dilated 50% corridor, 1,000 streamlines) | 0.05 | Value used in the atlas repository's example |
| MRtrix3 default for FOD-based tracking | 0.05 | For reference |
Note. A cutoff of 0.01 is usable only with the corridor's exclusion mask. Without the mask it produces streamlines throughout the brain.
Because lower field strength yields noisier FOD estimates, a cutoff higher than the 7 T values (approximately 0.08) was anticipated for 3 T data. The pilot sweep did not support that expectation: the conservative cutoffs failed to reach the target in several participants, and 0.01 reached it in all of them with about one fifth of the seeds.
Pilot sweep
The sweep uses five participants, four cutoffs and reduced budgets (-select 1000, -seeds 5000000); all other parameters match the production run.
bash 04_tune_cutoff.sh "sub-01 sub-02 sub-03 sub-04 sub-05" "0.1 0.08 0.06 0.01"
The script reports streamlines selected, streamlines generated and mean length for each participant and cutoff. tckgen generates one streamline per seed, so the number generated is also the number of seeds consumed. Table 2 gives the streamline counts obtained in the example dataset. At 0.1 most runs exhausted the seed budget before reaching the target. At 0.08 some participants reached the target and one stopped at 309. At 0.06 and at 0.01 all runs reached the target; the 0.01 runs consumed approximately one fifth of the seeds (about 415,000 versus 2.1 million or more at 0.06). Reaching the target in every pilot participant is a necessary condition for a cutoff; the reconstructions must also correspond to the tract, which is assessed next.
Table 2
Streamlines Reached by Cutoff in the Pilot Sweep, Posterior VTA → Hippocampus
| Participant | Hemisphere | 0.1 | 0.08 | 0.06 | 0.01 |
|---|---|---|---|---|---|
| P1 | L | 118 | 556 | 1000 | 1000 |
| P1 | R | 30 | 434 | 1000 | 1000 |
| P2 | L | 274 | 1000 | 1000 | 1000 |
| P2 | R | 165 | 906 | 1000 | 1000 |
| P3 | L | 1000 | 1000 | 1000 | 1000 |
| P3 | R | 1000 | 1000 | 1000 | 1000 |
| P4 | L | 88 | 309 | 1000 | 1000 |
| P4 | R | 731 | 1000 | 1000 | 1000 |
Note. Target 1,000 streamlines; seed limit 5 million. P1 to P4 = pilot participants; L = left; R = right.
Side-by-side comparison
For each participant, the tract-density image (TDI) at each cutoff is rendered on the same axial and coronal slices, one column per cutoff. Dice overlap of each cutoff against the most conservative one, the number of TDI voxels, and the mean and standard deviation of streamline length are computed and summarized.
python 04b_compare_cutoffs.py "sub-01 sub-02 sub-03 sub-04 sub-05" "0.1 0.08 0.06 0.01"
The script writes one panel per participant, cutoff_summary.csv, and a summary chart (Figures 1 and 2). In the example dataset the two cutoffs traced the same trajectory in both views. The 0.01 reconstruction was somewhat thicker (mean Dice = .66 against 0.06), mean lengths were similar (approximately 44 versus 47 mm), and the length standard deviation was slightly greater at 0.01 (7 versus 6 mm). Bundle cleaning (Step 6) removes the outlying streamlines responsible for the additional thickness; the cleaned 0.01 bundle is more compact than the uncleaned 0.06 bundle, as shown on that page.
Figure 1
Tract-Density Images at Two Cutoffs, Uncleaned
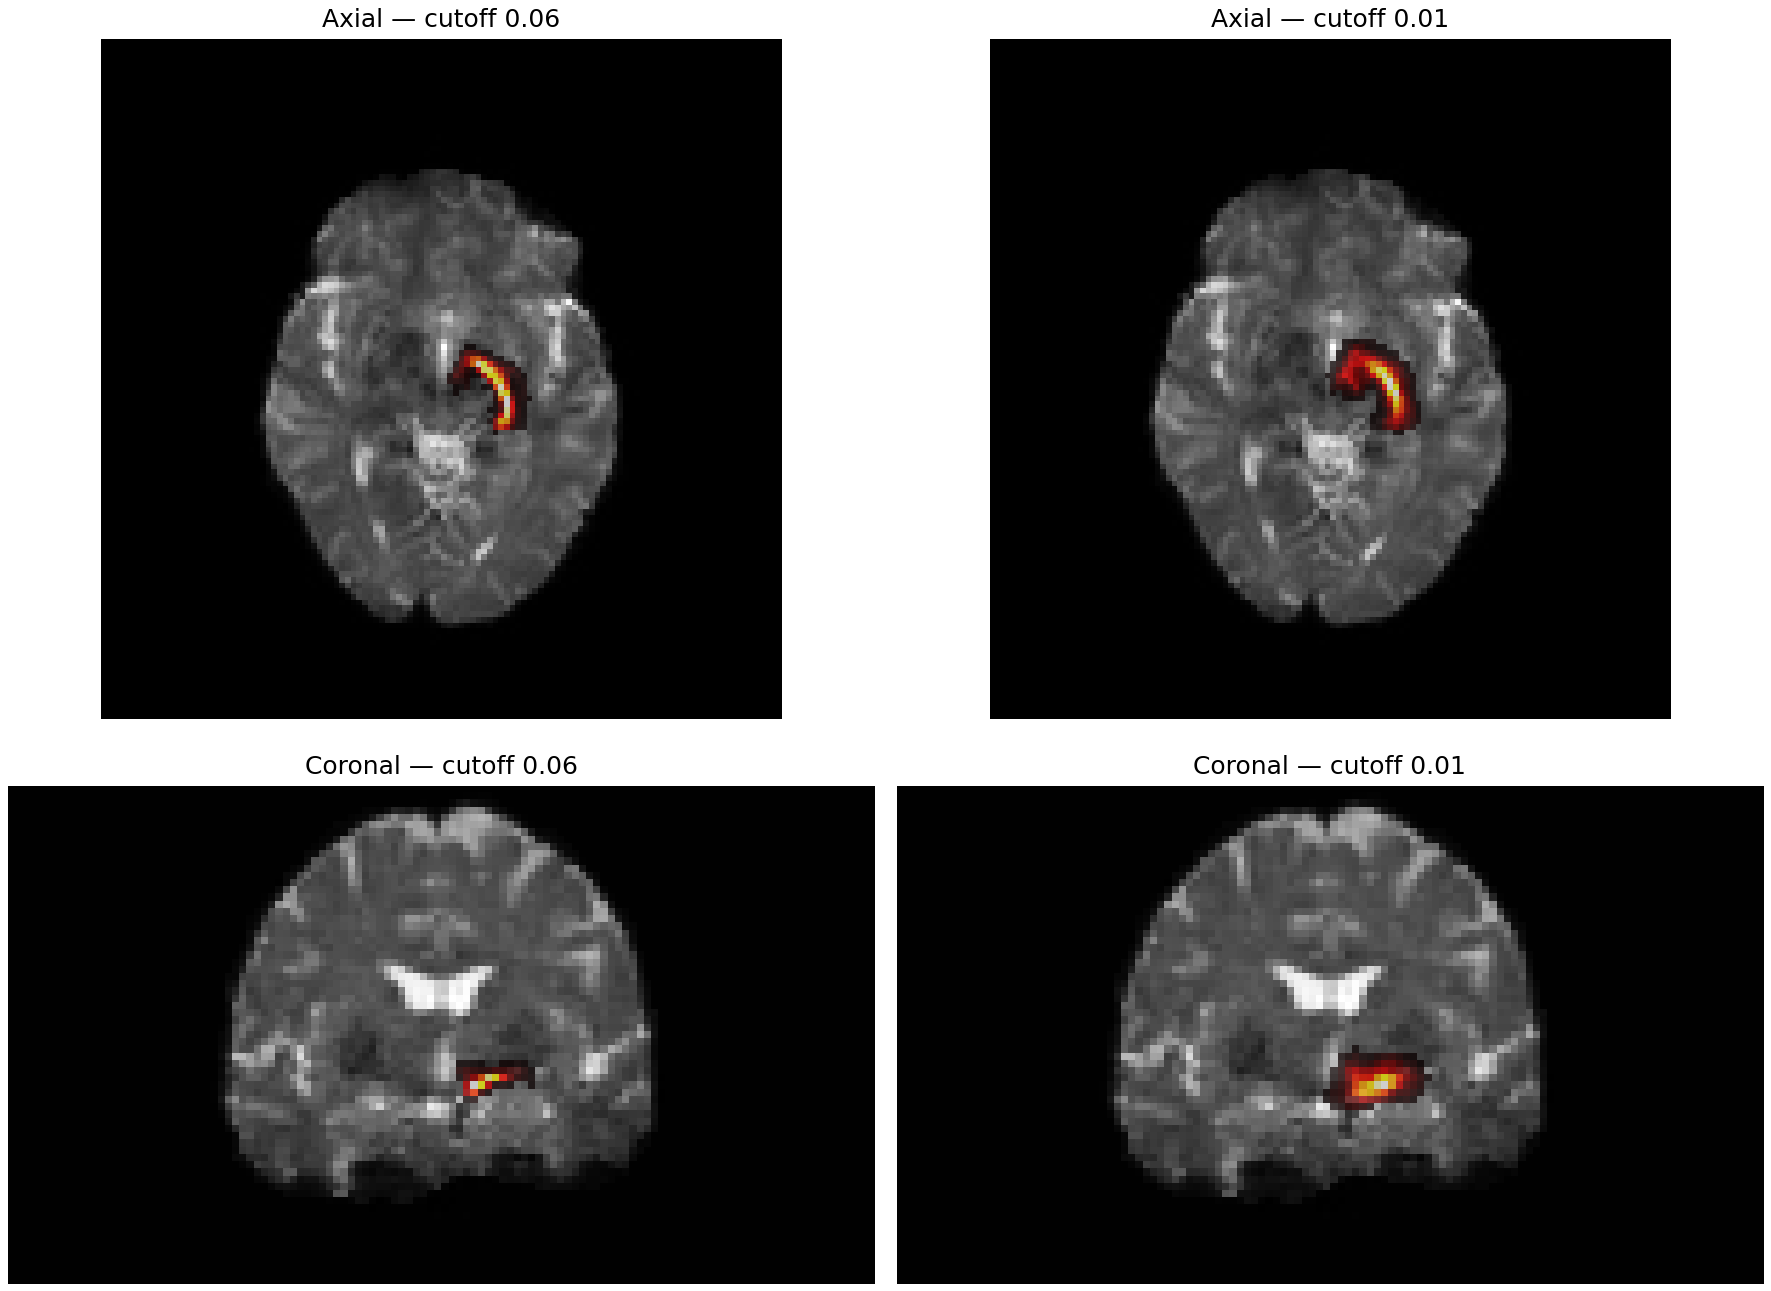
Note. Cutoff 0.06 (left) and 0.01 (right) for one participant, left posterior VTA → hippocampus.
Figure 2
Summary Statistics by Cutoff Across the Pilot Participants
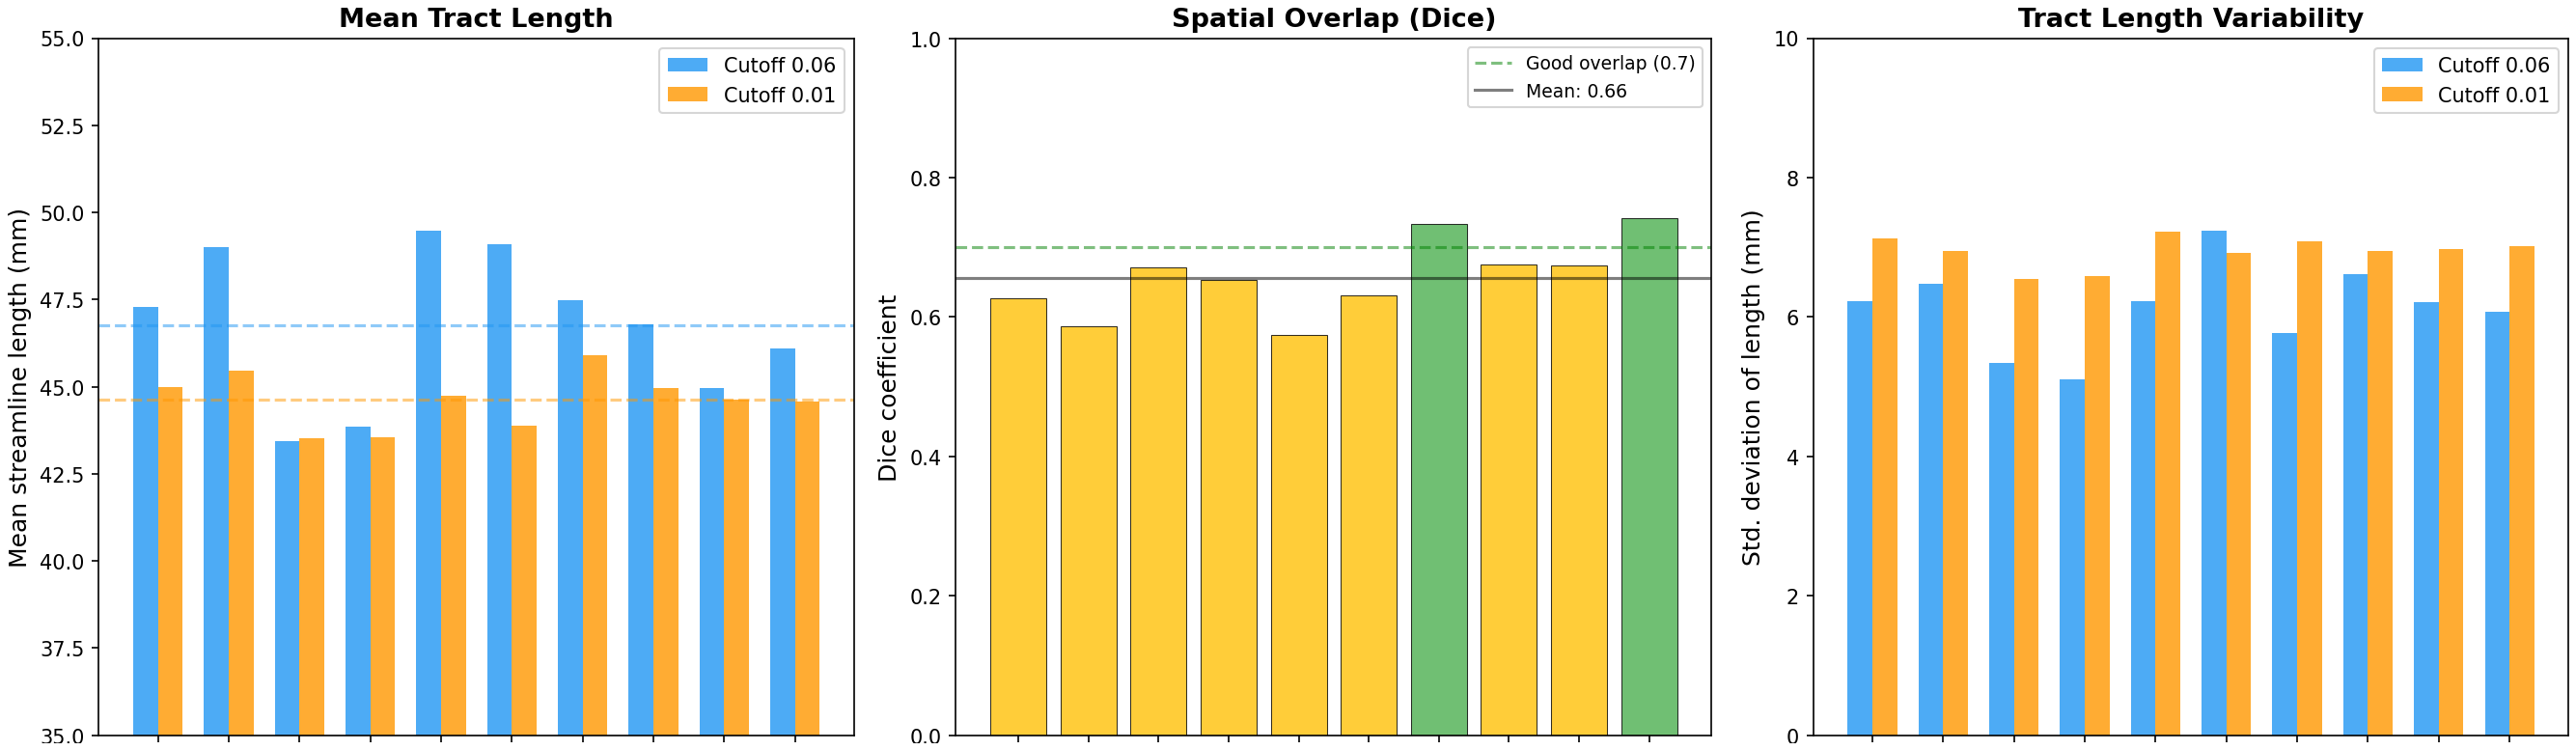
Note. Bars are grouped by pilot participant and hemisphere. Left: mean streamline length. Middle: Dice overlap between cutoffs. Right: standard deviation of streamline length.
Selection criterion
The cutoff selected is the most permissive value that reaches the streamline target in every pilot participant and whose reconstruction matches the conservative reconstruction. In the example dataset this was 0.01, the value in routine use (Table 1). A higher value is warranted only when the 0.01 reconstruction departs from the conservative reconstruction in the side-by-side images, for example by filling the corridor rather than following the tract; the next value in Table 1 (0.06) is then tried. The sweep should be repeated for each tract family, since a cutoff confirmed for VTA → hippocampus is a starting value for other pathways.
Options not used
Anatomically constrained tractography (ACT) was evaluated during atlas construction and abandoned because the tissue segmentation's white-matter mask was too restrictive relative to the gray-matter mask and tracts did not reconstruct. The -backtrack and -crop_at_gmwmi options and custom -angle and -step_size values were left at MRtrix3 defaults. These options should be introduced only in response to a specific, observed failure.
Scripts
Script 04_tune_cutoff.sh (53 lines)
#!/bin/bash
# =============================================================================
# Step 4. Pilot sweep of the FOD amplitude cutoff
# =============================================================================
# Runs reduced-budget tractography at several cutoffs in a few pilot participants.
# Needs $PROJECT/dwi/<s>/wm_fod_norm.mif (Step 0b) and, from Steps 2 and 3, $OUT/<s>/rois/
#   <TRACT>_seed_diff.nii.gz, <TRACT>_target_diff.nii.gz, <TRACT>_exclusion_mask.nii.gz
# Writes $OUT/<s>/tckgen/<TRACT>/<TRACT>_pilot_<cutoff>.tck and $OUT/logs/04_tune_cutoff.sh.log
# Usage: bash 04_tune_cutoff.sh [participants] [cutoffs]; defaults: first 5, 0.1 0.08 0.06 0.01
source "$(dirname "$0")/00_config.sh"
start_log "$0"
read_subjects

PILOT=${1:-${SUBJECTS[*]:0:5}}
# Highest cutoff first: 04b_compare_cutoffs.py uses the first one as its Dice reference.
CUTOFFS=${2:-"0.1 0.08 0.06 0.01"}
# Reduced budgets so the sweep is cheap; the seed cap stops a failing cutoff in bounded time.
PILOT_SELECT=1000
PILOT_SEEDS=5000000

printf "%-12s %-8s %-12s %-12s %-12s\n" Subject Cutoff Selected Generated MeanLen_mm
for s in $PILOT; do
  rois="$OUT/$s/rois"
  tdir="$OUT/$s/tckgen/$TRACT"
  if [ ! -f "$rois/${TRACT}_exclusion_mask.nii.gz" ]; then
    echo "!! $s missing corridor (run Steps 2 and 3)"
    continue
  fi
  mkdir -p "$tdir"
  for c in $CUTOFFS; do
    tck="$tdir/${TRACT}_pilot_${c}.tck"
    # -seed_unidirectional: track one way from the seed.  -stop: end the streamline once it
    # enters the target.  -exclude: the inverted corridor, so a streamline dies on leaving it.
    tckgen "$PROJECT/dwi/$s/wm_fod_norm.mif" "$tck" \
      -algorithm iFOD2 \
      -seed_image "$rois/${TRACT}_seed_diff.nii.gz" -seed_unidirectional \
      -include "$rois/${TRACT}_target_diff.nii.gz" \
      -exclude "$rois/${TRACT}_exclusion_mask.nii.gz" \
      -select "$PILOT_SELECT" -seeds "$PILOT_SEEDS" -cutoff "$c" \
      -minlength "$MINLEN" -maxlength "$MAXLEN" -stop \
      -nthreads "$NTHREADS" -force -quiet
    count=$(tckinfo "$tck" | awk '$1 == "count:" {print $2}')
    generated=$(tckinfo "$tck" | awk '$1 == "total_count:" {print $2}')
    if [ "${count:-0}" -gt 0 ]; then
      meanlen=$(tckstats "$tck" -output mean -quiet | awk '{print $1}')
    else
      meanlen=NA
    fi
    printf "%-12s %-8s %-12s %-12s %-12s\n" "$s" "$c" "$count" "$generated" "$meanlen"
  done
done
echo "Reaching the streamline target in every pilot participant is necessary but not"
echo "sufficient: compare the reconstructions with 04b_compare_cutoffs.py before choosing."
Script 04b_compare_cutoffs.py (163 lines)
#!/usr/bin/env python3
"""Step 4b. Compare pilot tractograms from 04_tune_cutoff.sh to pick CUTOFF for 00_config.sh.

Inputs:  $OUT/<subj>/tckgen/<TRACT>/<TRACT>_pilot_<cutoff>.tck
         $PROJECT/dwi/<subj>/nodif_brain_mask.nii.gz and mean_b0.nii.gz (optional)
Outputs: $OUT/qc/<TRACT>_cutoff_pilot/<subj>_cutoff_compare.png
         $OUT/qc/<TRACT>_cutoff_pilot/cutoff_summary.csv and cutoff_summary.png
Run:     source 00_config.sh
         python 04b_compare_cutoffs.py "sub-01 sub-02 sub-03" "0.1 0.08 0.06 0.01"
         Both arguments optional; list the most conservative cutoff first (Dice reference).
"""
import os
import subprocess
import sys
from pathlib import Path

# File-only backend: this usually runs on a cluster node with no display.
import matplotlib
matplotlib.use("Agg")
import matplotlib.pyplot as plt
import nibabel as nib
import numpy as np
import pandas as pd


# Read one variable exported by 00_config.sh; fail clearly if it was not sourced.
def env(name):
    if name not in os.environ:
        sys.exit(f"{name} is not set: run `source 00_config.sh` first")
    return os.environ[name]


PROJECT = Path(env("PROJECT"))
OUT = Path(env("OUT"))
TRACT = env("TRACT")

if len(sys.argv) > 1:
    PILOT = sys.argv[1].split()
else:
    PILOT = Path(env("SUBJECTS_FILE")).read_text().split()[:5]
# Cutoffs stay strings: "0.1" has to match the file name 04_tune_cutoff.sh wrote.
CUTOFFS = sys.argv[2].split() if len(sys.argv) > 2 else ["0.1", "0.08", "0.06", "0.01"]
REFERENCE = CUTOFFS[0]          # most conservative cutoff: reference for Dice overlap

QC = OUT / "qc" / f"{TRACT}_cutoff_pilot"
QC.mkdir(parents=True, exist_ok=True)


# Run a command and return its stdout; check=True so a damaged .tck stops the script.
def run(cmd):
    return subprocess.run(cmd, capture_output=True, text=True, check=True).stdout


def tck_summary(tck):
    """Streamlines selected, generated (selected plus rejected), mean and SD of length (mm)."""
    info = {}
    for line in run(["tckinfo", str(tck)]).splitlines():
        key, _, value = line.strip().partition(":")
        info[key] = value.strip()
    # "count" is what tckgen kept; "total_count" is everything it generated (one per seed).
    count = int(info.get("count", 0))
    generated = int(info.get("total_count", 0))
    if count == 0:
        return count, generated, np.nan, np.nan
    # -output mean/std: print that one number only, so the whole stdout casts to float.
    mean = float(run(["tckstats", str(tck), "-output", "mean", "-quiet"]))
    sd = float(run(["tckstats", str(tck), "-output", "std", "-quiet"]))
    return count, generated, mean, sd


def density_mask(tck, template, scratch):
    """Binary mask of the voxels visited by at least one streamline."""
    # tckmap: tract-density image; -template puts it on the brain mask's voxel grid.
    run(["tckmap", str(tck), str(scratch), "-template", str(template), "-force", "-quiet"])
    # Binarise at zero so a sparse stray branch counts as much as the core.
    mask = nib.load(str(scratch)).get_fdata() > 0
    scratch.unlink()
    return mask


# Dice overlap of two boolean masks; NaN when both are empty.
def dice(a, b):
    total = a.sum() + b.sum()
    return 2 * np.logical_and(a, b).sum() / total if total else np.nan


# One slice: grey background with the tract mask drawn on top.
def overlay(ax, background, mask, title):
    ax.imshow(np.rot90(background), cmap="gray")
    ax.imshow(np.rot90(np.ma.masked_where(~mask, mask.astype(float))),
              cmap="autumn", alpha=0.8, vmin=0, vmax=1)
    ax.set_title(title, fontsize=10)
    ax.axis("off")


rows = []
for s in PILOT:
    # The mean b0 is optional in the project layout, so fall back to the brain mask.
    template = PROJECT / "dwi" / s / "nodif_brain_mask.nii.gz"
    b0 = PROJECT / "dwi" / s / "mean_b0.nii.gz"
    background = nib.load(str(b0 if b0.exists() else template)).get_fdata()

    masks = {}
    for c in CUTOFFS:
        # A missing tractogram is skipped, not fatal, so a partial sweep still plots.
        tck = OUT / s / "tckgen" / TRACT / f"{TRACT}_pilot_{c}.tck"
        if not tck.exists():
            print(f"[{s}] cutoff {c}: no tractogram (run 04_tune_cutoff.sh)")
            continue
        count, generated, mean, sd = tck_summary(tck)
        masks[c] = density_mask(tck, template, QC / f"_{s}_{c}_tdi.nii.gz")
        rows.append({
            "subject": s, "cutoff": c, "selected": count, "generated": generated,
            "voxels": int(masks[c].sum()), "mean_len_mm": mean, "sd_len_mm": sd,
        })
    if not masks:
        continue

    # Dice against the reference; rows holds every participant so far, hence the ID filter.
    for row in rows:
        if row["subject"] == s and REFERENCE in masks:
            row["dice_vs_reference"] = round(dice(masks[REFERENCE], masks[row["cutoff"]]), 3)

    # One slice for every column: the fullest axial and coronal slice of the union.
    union = np.logical_or.reduce(list(masks.values()))
    k_axial = int(np.argmax(union.sum(axis=(0, 1))))
    k_coronal = int(np.argmax(union.sum(axis=(0, 2))))

    fig, axes = plt.subplots(2, len(masks), figsize=(3.2 * len(masks), 6.4), squeeze=False)
    for j, (c, mask) in enumerate(masks.items()):
        overlay(axes[0][j], background[:, :, k_axial], mask[:, :, k_axial],
                f"Axial, cutoff {c}")
        overlay(axes[1][j], background[:, k_coronal, :], mask[:, k_coronal, :],
                f"Coronal, cutoff {c}")
    # "uncleaned" is deliberate: judge the path, not the width; Step 6 trims the excess.
    fig.suptitle(f"{s}  {TRACT}  pilot cutoffs (uncleaned)", fontsize=11)
    fig.tight_layout()
    fig.savefig(QC / f"{s}_cutoff_compare.png", dpi=110, bbox_inches="tight")
    plt.close(fig)
    print(f"[{s}] wrote {s}_cutoff_compare.png")

if not rows:
    sys.exit("no pilot tractograms found")

summary = pd.DataFrame(rows)
summary.to_csv(QC / "cutoff_summary.csv", index=False)

# Mean across pilot participants, one bar per cutoff; Dice is in the CSV only.
panels = [("selected", "Streamlines selected"), ("generated", "Streamlines generated"),
          ("voxels", "Occupied voxels"), ("sd_len_mm", "SD of length (mm)")]
# sort=False keeps command-line order; sorted as strings, "0.1" would land after "0.08".
means = summary.groupby("cutoff", sort=False)[[k for k, _ in panels]].mean()
fig, axes = plt.subplots(1, len(panels), figsize=(15, 3.6))
for ax, (key, title) in zip(axes, panels):
    ax.bar(means.index.astype(str), means[key], color="#3A6B8C")
    ax.set_title(title)
    ax.set_xlabel("FOD amplitude cutoff")
fig.tight_layout()
fig.savefig(QC / "cutoff_summary.png", dpi=110)
plt.close(fig)

print(summary.to_string(index=False))
print(f"\nsummary -> {QC / 'cutoff_summary.csv'} and cutoff_summary.png")