Atlas construction
The MesoConnect Atlas was generated from Human Connectome Project (HCP) 7 T diffusion MRI (Vu et al., 2015). Probabilistic tractography was performed in each participant's native space, and the reconstructions were aggregated in Montreal Neurological Institute (MNI) space (Figure 1). All seven bilateral pathways were reconstructed in most of the 173 tractography-eligible participants, with 166 to 173 usable bilateral reconstructions per pathway entering the manuscript analysis. The pathway-specific commands and masks are in the analysis-code folder of the atlas repository.
Figure 1
Atlas-Generation Workflow
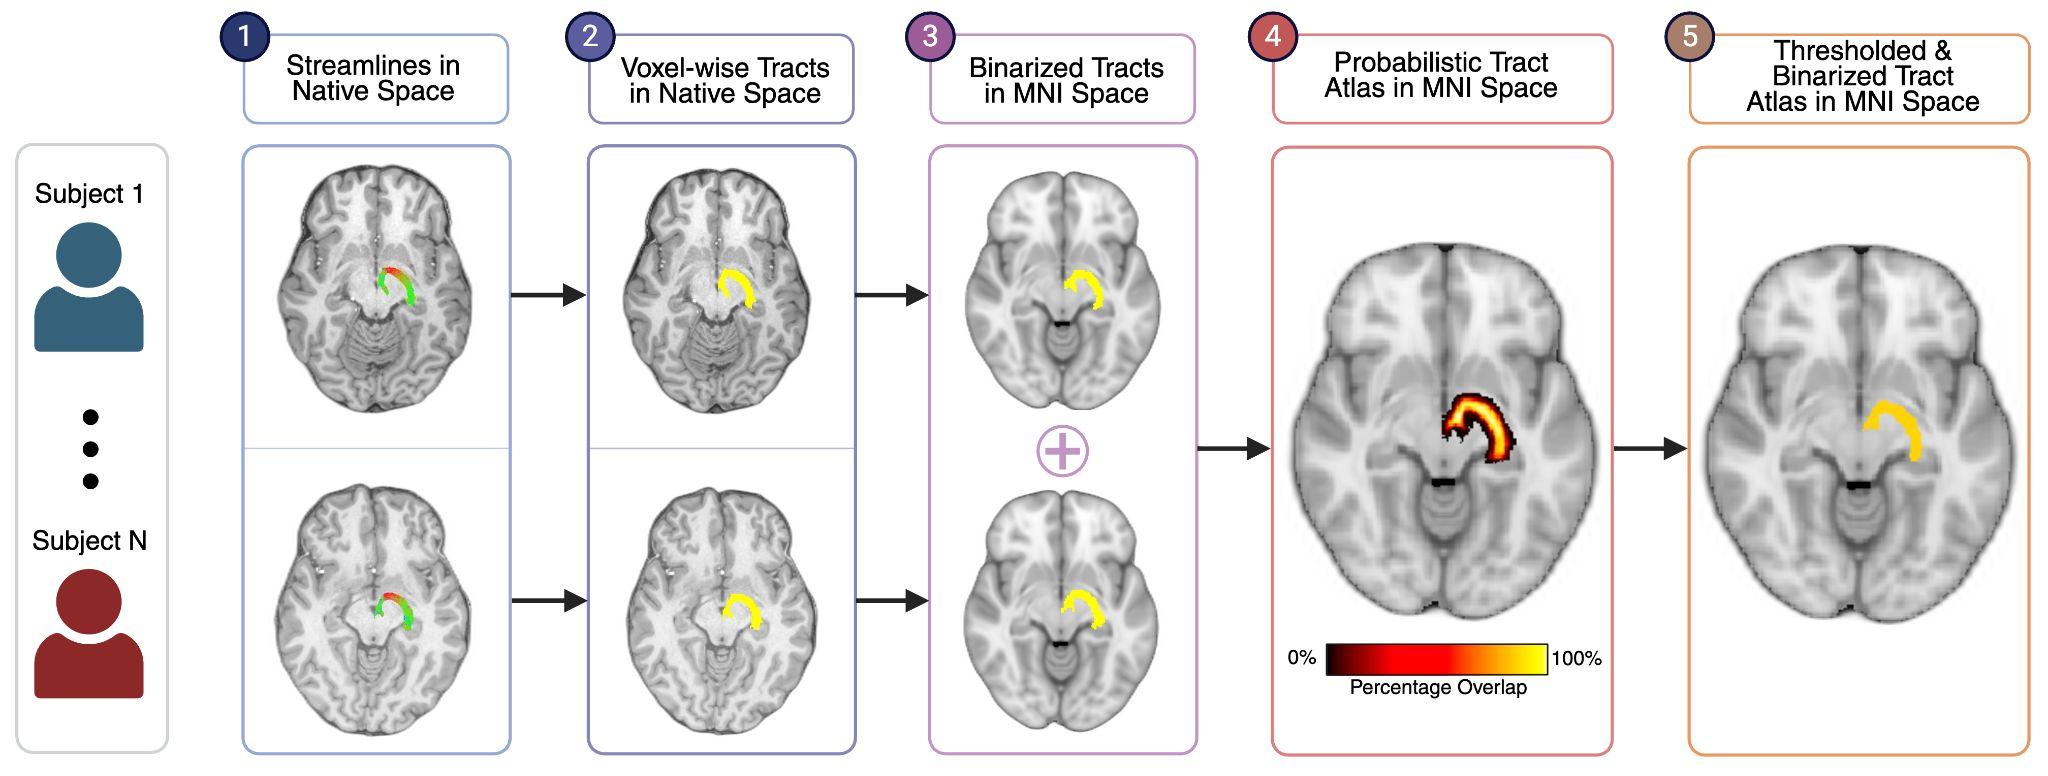
Note. Participant-native tractograms were converted to binary voxel maps, transformed to MNI space, aggregated across participants, and thresholded at participant-overlap levels to produce the group probabilistic atlas. Figure from the MesoConnect repository (CC BY 4.0).
Procedure
- Intensity-normalized white-matter fibre orientation distributions (FODs) were estimated for each participant.
- Each pathway was reconstructed with MRtrix3 iFOD2 (Tournier et al., 2010) under pathway-specific anatomical constraints (Table 1), with unidirectional seeding, 2,500 accepted streamlines, a ceiling of 25 million seeding attempts and the
-stopoption. Anatomically constrained tractography and backtracking were not used. - Tractograms were cleaned and inspected slice by slice.
- Valid tractograms were converted to binary participant-level voxel maps.
- The binary maps were transformed to FSL MNI152 1 mm space.
- Participant maps were summed and divided by the number of contributing participants, giving the overlap-proportion map of each pathway and hemisphere.
- The overlap-proportion maps were thresholded at 50% to give the binary consensus maps.
Tracking parameters
Table 1
Atlas-Generation Tractography Settings by Pathway
| Pathway | Seed → required inclusion | FOD cutoff | Length | Angle | Step |
|---|---|---|---|---|---|
| Inferior VTA → NAc | VTA → ipsilateral NAc | 0.03 | 8–35 mm | 7° | 0.25 mm |
| Superior VTA → NAc | VTA → ipsilateral NAc | 0.03 | 8–35 mm | default | default |
| VTA → amygdala | VTA → ipsilateral amygdala | 0.08 | 27–40 mm | default | default |
| VTA → posterior hippocampus | VTA → ipsilateral posterior hippocampus | 0.06 | 35–65 mm | default | default |
| VTA → anterior hippocampus | VTA → ipsilateral anterior hippocampus | 0.06 | 35–65 mm | default | default |
| Hippocampus → NAc → VP | hippocampus → fornix → NAc → VP | 0.04 | minimum 5 mm, no maximum | default | default |
| VP → VTA | VP → VTA | 0.03 | 15–25 mm | 15° | default |
Note. NAc = nucleus accumbens; VP = ventral pallidum; VTA = ventral tegmental area. "Default" is the MRtrix3 default. These are the settings that generated the atlas. The corridor workflow on this site applies the finished atlas with its own settings, selected in Step 4.
Anatomical constraints
Each pathway was defined by seed, target or waypoint, and exclusion masks appropriate to its anatomy. Endpoint and waypoint regions were the VTA, the anterior or posterior hippocampus, the amygdala, the NAc, the VP and the fornix. Broad tissue exclusions were cortical gray matter, cerebellum, thalamus and inferior brainstem. Local exclusions, applied per pathway, were the red nucleus, lateral hypothalamus, mammillary bodies, optic structures and striatum. Laterality was enforced with contralateral-hemisphere and contralateral-target exclusion masks. For the VTA → hippocampus and VTA → amygdala reconstructions the fornix body was excluded so that streamlines did not follow a fornical route, and the inferior and superior VTA → NAc pathways were separated by different anterior-commissure exclusions. The tract families page lists the exclusion-mask categories; the pathway-specific commands are in the repository's analysis-code folder.
Contributing participants
Each atlas map aggregates 166 to 173 participants per hemisphere (Table 2).
Table 2
Participants Contributing to Each Atlas Map
| Pathway | Left | Right |
|---|---|---|
| Inferior VTA → NAc | 173 | 173 |
| Superior VTA → NAc | 173 | 173 |
| VTA → amygdala | 168 | 168 |
| VTA → anterior hippocampus | 167 | 167 |
| VTA → posterior hippocampus | 168 | 168 |
| Hippocampus → NAc → VP | 166 | 166 |
| VP → VTA | 170 | 171 |
Note. Counts are the denominators of the overlap-proportion maps (mesoconnect_subject_counts.csv in the atlas package). They are hemisphere-specific and need not equal the bilateral complete-case sample of a manuscript analysis.
Other analyses in the manuscript
The manuscript's remaining analyses, among them the endpoint topography of the inferior and superior VTA → NAc pathways (Figure 2), endpoint centre-of-mass analyses and hippocampal-subfield endpoint analyses, are outside this tutorial. Their code is in the analysis-code folder of the atlas repository: region-of-interest preparation, the tractography commands with their pathway-specific constraints, pyAFQ cleaning, QuickBundles clustering, tract and endpoint maps, tract statistics, atlas construction, neurite orientation dispersion and density imaging (NODDI) fitting, node-wise sampling, endpoint centre-of-mass analyses and FreeSurfer hippocampal-subfield workflows. The scripts retain the original project paths and participant lists and are published as reference code rather than as a turnkey pipeline.
Figure 2
Endpoint Topography of the Inferior and Superior VTA → NAc Pathways
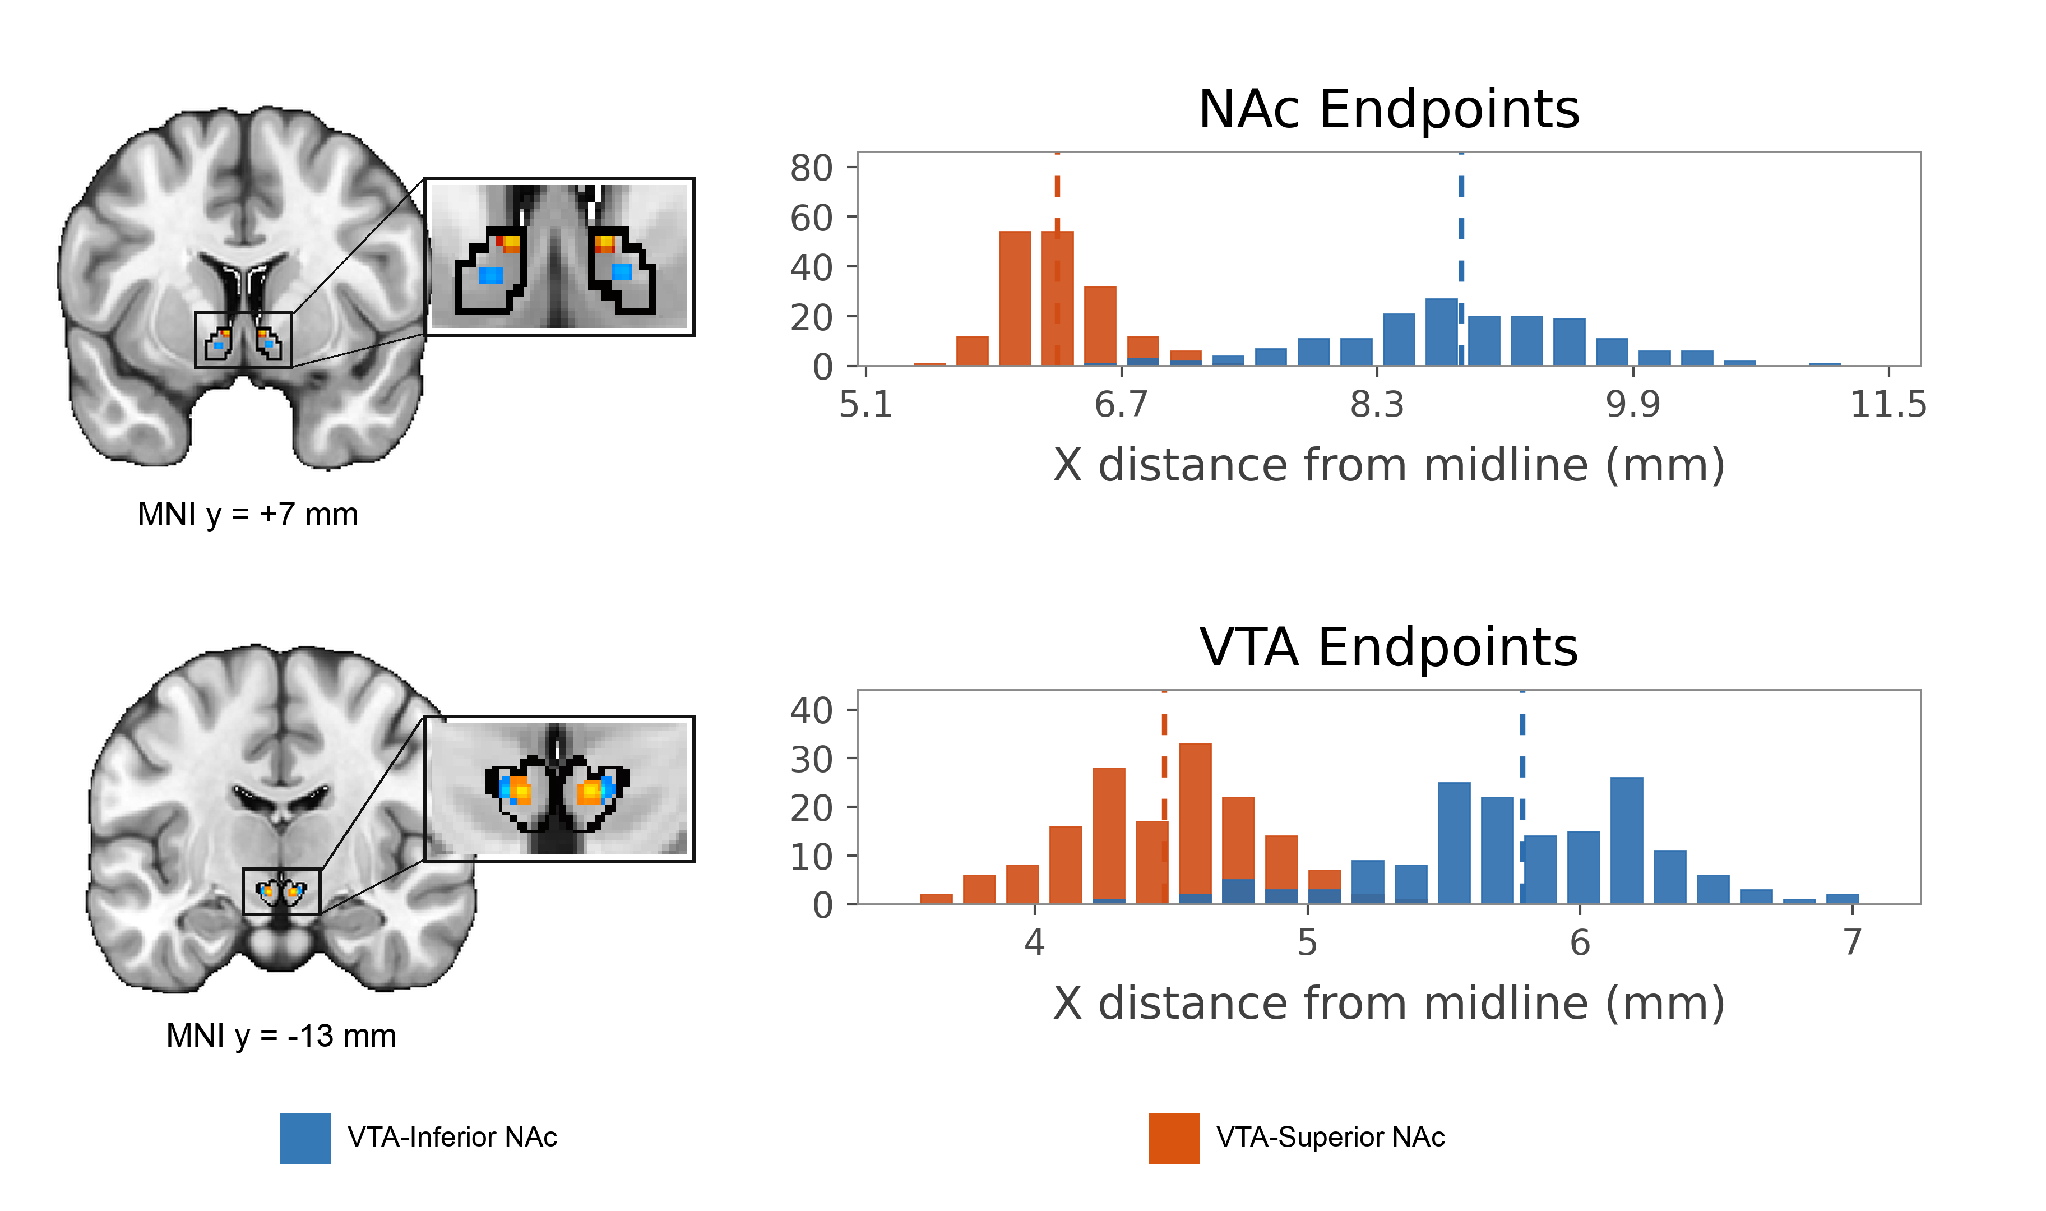
Note. Endpoint-density maps and histograms show separation of the two pathways at both the NAc and the VTA end. Figure from the MesoConnect repository (CC BY 4.0).